
Analysis of the choices of the low-income population.
Amparo Álvarez Poyó and Lissy La Paix
Abstract
This paper aims to examine the accessibility levels of public and private transportation in Santo Domingo by collecting GPS data through the smartphone app Inercia. Accessibility is defined as a combination of spatial, temporal, transport, and individual factors. GPS data offers advantages for travel demand models that have not been available in traditional accessibility models. The paper analyzes the various components of accessibility using GPS data, including a distance decay function for both motorized and non-motorized modes.
The authors recommend prioritizing the holdout data set to evaluate the model’s effectiveness on new and unknown data. The holdout data set can also be used to compare different models and select the best one for implementation. Models 4 and 2 are recommended over the others, followed by Model 1 and Model 3 because the holdout value is the lowest.
Keywords: mobility, sustainable, transport, environment, neural networks
- Introduction
Public transport feeder modes are not always aligned with the main service in terms of schedule, route, and stop location. Recent research explored the potential of shared mobility, e.g. uber, as first/last mile service to transit (Azimi et al., 2021). Similarly, walkability and safety are important factors in mode and route choice when it comes to developing countries. Several factors influence the use of public transport among lower-income populations. For example, an explicit public transport service is available to feed the main transport mode. In the context of low-income neighborhoods, populations often have to walk or rely on informal public transportation modes (e.g. motoconchos) to reach high-investment main transport service (e.g. metro). The asymmetry of the services is a matter of concern from the perspective of accessibility to public transport. Other aspects, such as safety, also play a crucial role. For example, literature shows that the prevalence of violent crimes in transit corridors reduces the odds of transit use (Tilahun et al., 2016).
In the Dominican Republic, particularly in the city of Santo Domingo, high investments are being made to support public transportation. However, several impedances are still major issues in the compacity of the service. For example, the availability of synchronized public transport services, including vehicles (e.g. bus, shared cars) to and from the main metro stations. (2) the integration of payments; (3) smoothness of payments; (4) capacity, which means that several metro cars are operating at full capacity due to the lack of vehicles, even though the station is designed for longer vehicles.
According to the First Biennial Update Report of the Dominican Republic to the United Nations Framework Convention on Climate Change (Ministry of Environment and Natural Resources and National Council for Climate Change and Clean Development Mechanism, 2020), the Energy sector, which includes fossil fuel consumption in the country and associated fugitive emissions, is the main emitting sector of GHG in the country, contributing 62.75% to total emissions and accounting for 90.39% of the GHG balance in 2015, the year of the last inventory.
Access and egress to public transport stations is a major challenge for developing countries. In the Dominican Republic, mobility data is an important challenge for the transportation authorities, monitoring daily volumes of trips is a pending task. Government major investments are allocated to infrastructure. Several cities in Latin America are concerned about the asymmetry of public transport services when a new station is open. It means that users are not able to properly accomplish the first and last mile to and from the new service, respectively.
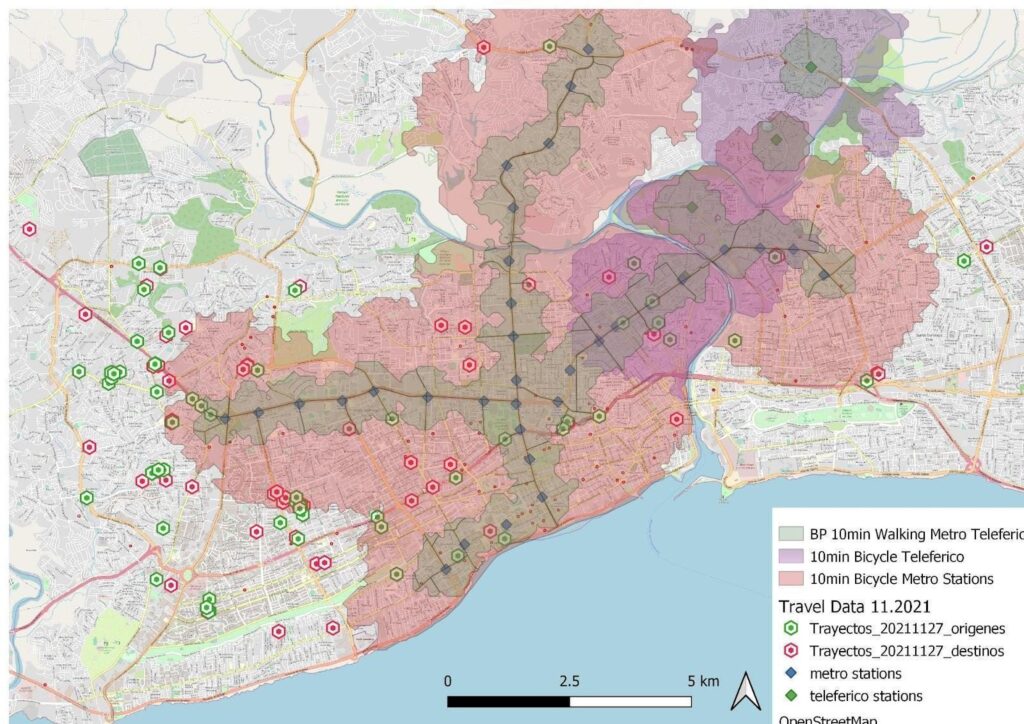
This research evaluates the existing condition and possible accessibility scenario improvements of the public transport network in Santo Domingo, the Dominican Republic. The data was collected with a mobile phone app able to track user’s trips. As data enrichment, the time and cost of alternatives not chosen by origin-destination were calculated. Additional geographical data related to jobs, land use, and commercial use was linked to the trip data to identify potential activity patterns. An impedance curve was developed to represent the probability of traveling to a destination within a certain travel time since longer travel times are less likely to occur than shorter travel times. Accessibility is a weighted function (by the impedance) for the attractivity of the place x travel time. Accessibility models were developed and showed the potential of several zones and stations.
This paper aims to investigate the accessibility levels of public and private transport in the city of Santo Domingo. Furthermore, the creation of models that incorporate variables such as accessibility, distance, and speed, among other factors, involves working with neural networks. From the developing country perspective, this paper elaborates on the accessibility gaps for different income groups. The paper is based on GPS data collection in the city of Santo Domingo using a smartphone app named Inertia.
Literature Review
Accessibility is widely recognized as an important performance indicator for the transportation-land use system, but there is no consensus on its definition. Different definitions have been proposed, such as Hansen’s concept of “the potential of opportunities for interaction” and Ben-Akiva and Lerman’s view of accessibility as “the benefits provided by a transportation/land use system.” These definitions have led to various measures of accessibility, each with its own advantages and limitations (He et al., 2019).
It is important to recognize that accessibility is a subjective construct and can be interpreted differently. Additionally, each measure of accessibility has its own strengths and weaknesses in terms of representing preferences, data requirements, theoretical appeal, and communicability. For example, activity-based accessibility (ABA) considers individuals’ daily activity schedules and captures population heterogeneity, while aggregate measures like gravity-based accessibility are simpler and more suitable for data-poor environments and stakeholder engagement (He et al., 2019).
Real estate agents often emphasize the importance of “location, location, location” in real estate, which aligns with the concept of accessibility in an academic sense. Accessibility should encompass access to opportunities, amenities, and transportation options. Understanding the relationship between accessibility and location preferences is crucial for transportation-land use policies, infrastructure investments, and transit-oriented development. Researchers have demonstrated the link between accessibility and the desirability of a property or residential location through various models and methods, such as residential location choice models and hedonic price models. However, it remains unclear how to best represent the value that households and the marketplace on accessibility. The question arises of whether sophisticated accessibility measures truly reflect real preferences or are merely theoretical constructs (He et al., 2019).
Despite the significance of accessibility in theory and politics, it is often misunderstood, poorly defined, and measured using simplistic approaches that rely on partial indicators. Developing an operational and theoretically sound concept of accessibility is a challenging and complex task because there is no universally accepted measure for it. The choice of measure depends on the specific problem being studied and the availability of statistical resources, such as data (Maroto & Zofío, 2016).
Traditionally, accessibility has been analyzed using isolated indicators commonly found in the literature. However, some researchers have recently employed non-parametric methodologies like Data Envelopment Analysis (DEA) or its extensions, such as Multi-Stage Network Data Envelopment Analysis, to construct a synthetic accessibility index. This index combines the complementary information provided by different accessibility indicators, offering a more comprehensive and holistic representation of accessibility (Maroto & Zofío, 2016).
While accessibility is widely acknowledged as a crucial factor in determining transportation demand, establishing a clear functional relationship between accessibility and demand is not straightforward. Incorporating feedback loops that convey the quality of transportation supply through log-sums to the trip generation step is technically feasible but requires a robust empirical basis (Kröger et al., 2018).
In practice, spatial aspects of home-based trip generation rates are indirectly addressed by considering variations in population sizes and household type distributions across traffic cells. However, this approach may not adequately capture medium to long-term effects of demographic changes and internal migration. Furthermore, there is often a disparity in the level of sophistication between the different stages of the four-step transportation modeling algorithm. The trip generation computation, in particular, tends to remain static and insensitive to major improvements in transportation infrastructure, such as the introduction of high-speed rail or new motorway links (Kröger et al., 2018).
In the context of Germany, the country’s data privacy legislation poses challenges in releasing georeferenced household-related mobility data at the necessary level of detail. Currently, there is no comprehensive database available for estimating mode and/or destination choices in a nationwide travel demand model. As a result, establishing a feedback loop that provides accessibility information for trip generation through log-sums is practically impossible. Alternative concepts are required to investigate the impacts of accessibility on trip rates for people residing in Germany (Kröger et al., 2018).
- Materials and Methods
Accessibility has been explained in the literature as a composition of spatial, temporal, transport, and individual components. At the same time, GPS data represents substantial advantages for travel demand models that so far have not been present in accessibility models. This section analyses the different accessibility components that will overcome the limitations of traditionally collected travel data through the implementation of GPS data.
- Transport component
There is a long discussion on accessibility measures and impedance functions, e.g. negative power, Gaussian, and log-logistic. Certain functions allow better behavioral representation, such as the S-shaped conventional logistic function (Geurs & van Eck 2001). The importance of having a distance decay function is to represent that shorter trips are more likely to be undertaken than longer trips. Similarly, closer facilities are more likely to be chosen than farther ones.
Some authors have explored origin-destination patterns based on passively collected data. For example, Hussain et al. (2021) analyzed origin–destination stops (entry-exit system) AFC transactions record stop-to-stop trips/journeys for buses and station-to-station for rail or subway. However, the smartcard data lack knowledge about how riders access the stop (or station), and how riders reach their destination (absence of first and last mile information). Nowadays, the research questions are primarily related to the conversion of stop level OD (stOD) to ztOD (zone level transit OD (ztOD) where it is concluded that there is great importance in using the latter and not just a simple matrix of origin-destination since it shows the case where walking is done to access/egress a stop. A few studies in the literature have worked on the inclusion of the first and last mile in tOD estimation from GPS data or smart (smartcard) data. Our approach considers the implementation of GPS measurements on accessibility indicators to reflect the first and last mile as the access and egress segments to main transport modes (public or private).
- Spatial Component and Station Class
According to the literature, the spatial component in accessibility refers to the location and characteristics of demand, and the location and characteristics of opportunities (Geurs and Rietsema, 2001). Classification of public transport nodes or stations means that certain nodes are better positioned in the transport network than others. This classification can infer the population, jobs, or other amenities reachable from certain nodes or zones. Potential accessibility to opportunities frequently represents this component.
The study by Luo et al. (2017) aims to combine stops at a micro-level and not aggregate stops a zone level. Other studies used more advanced clustering techniques, such as DB-SCAN, k-means clustering, etc., to aggregate the stops at a coarser level.(4) grouped the transit stops by applying the k-means clustering technique. The study minimizes the distance between stops within a group and maximizes intra-groups flow. By this method, stops can be aggregated efficiently. However, it does not solve the primary task of assigning trip proportion from a stop to all the near zones. The main focus of the formulation adopted in the above-cited articles is to find ways to group or cluster the transit stops. The authors assigned zones to trip by logit allocation technique and used variables such as walking distance, population or employment, and time of the day. The variables considered are land use (commercial, educational, residential, industrial, offices, and health) and a cost function to access or egress from a stop. However, there is a need to develop more robust methodologies incorporating first and last-mile problems collectively. The first and last mile may include but are not limited to the effect of park & ride facilities, kiss & ride, free on-street parking, and use of any other non-integrated public transport mode on aggregated ztOD.
Duncan et al.2020, formulates a new internally consistent Adaptive Path Size Logit (APSL) model wherein routes contribute to path size terms according to the ratio of route choice probabilities, ensuring that routes defined as unrealistic by the path size terms are exactly those with very low choice probabilities. Typically, real road networks have many very long routes that should be considered unrealistic. Such unrealistic routes are problematic for the Path Size Logit (PSL) model because they negatively impact the choice probabilities of realistic routes when links are shared.
Duncan at al.2020 shows that the APSL outperforms the Multinomial Logit (MNL) and PSL models with the same number of model parameters, while the GPSL model outperforms APSL due to the added flexibility an additional parameter provides. The APSL model requires a fixed-point algorithm to approximate solutions.


Leave a Comment